Introduction
"Conservation is a data problem. We have thousands of images, but how do we make sense of them?"
In the vast landscapes where we monitor wildlife, data flows in from everywhere: camera traps, drone surveys, and field reports. But raw data isn't enough. To make rapid, life-saving decisions for endangered species, conservationists need clarity. They need a system that turns a flood of JPEGs and GPS coordinates into actionable insights.
Enter the ConservaCam Dashboard. It isn't just a website; it’s a mission control centre for the wild. From the initial stage where one creates a user and assigns secure roles, to processing millions of data points, we've built a system that turns raw data into actionable insights. Here is how we built it.
1. The Pulse of the Park: Operational Overview
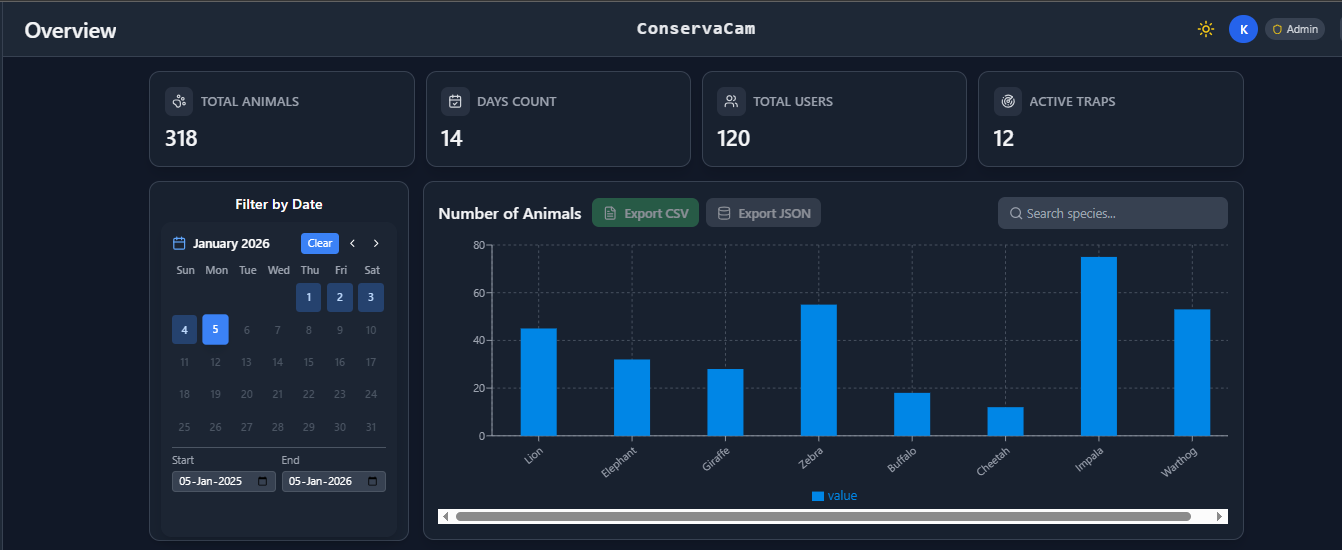
The Overview page is the decision-making hub. It aggregates millions of data points into a single "Health Check" for the park.
- Ecological Trends: Interactive charts track animal counts over time and break down detections by species, offering an instant snapshot of biodiversity health.
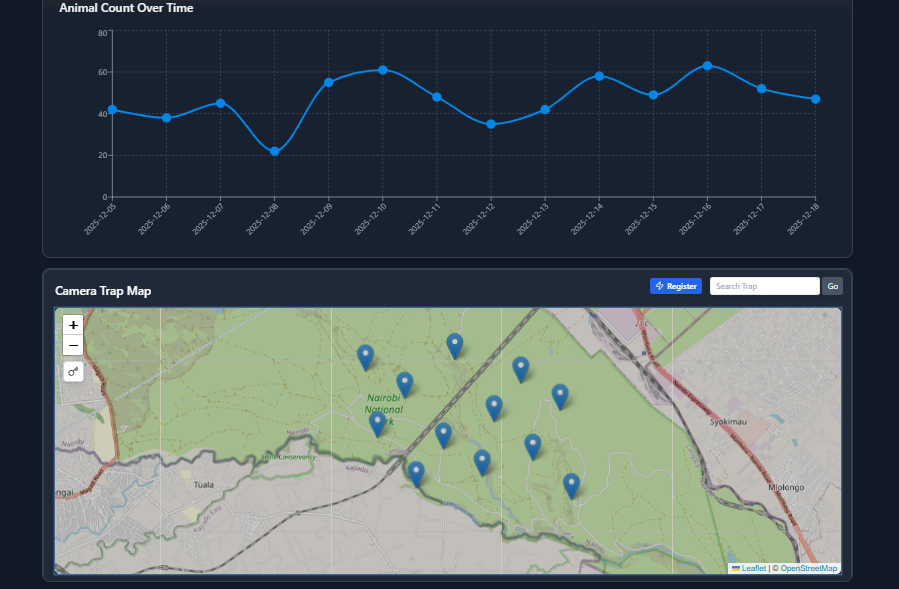
- Live Sensor Map: A real-time geospatial view of every device. We use colour-coded icons (Green for Online, Orange for Low Battery, Red for Offline, Black for the current inactive; previous location) so rangers know exactly which cameras need maintenance.
1.2 Sensor Registration: Onboarding New Eyes in the Field
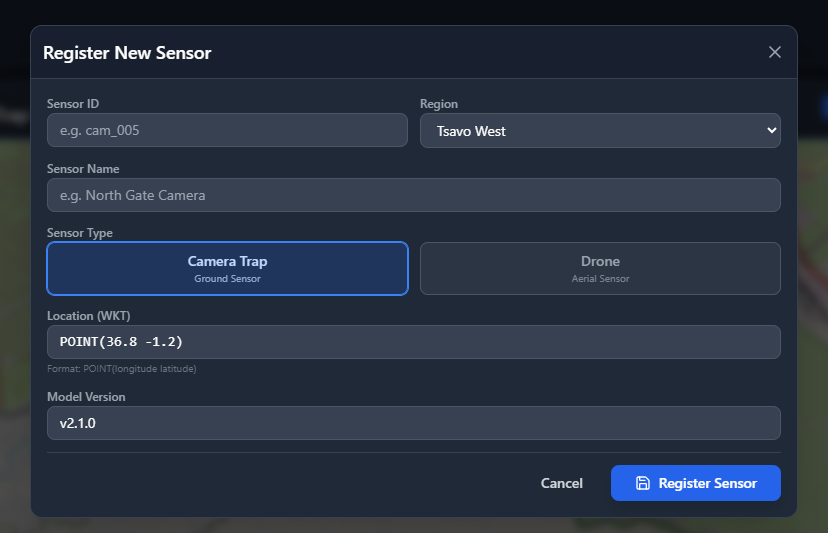
Before any data can flow, sensors must be registered in the system. Our Sensor Registration Modal streamlines this process.
- Dual Sensor Types: Users can register either Camera Traps (ground sensors) or Drones (aerial sensors) with a single toggle.
- Region-Based Access Control: The modal automatically loads regions based on the user's access permissions, ensuring data sovereignty across different national parks.
- Geospatial Precision: Location input uses WKT (Well-Known Text) format (
POINT(longitude latitude)), ensuring compatibility with PostGIS and spatial databases. - Model Version Tracking: Each sensor is tagged with the AI model version it's running (e.g.,
v2.1.0), critical for debugging detection accuracy issues later.
2. Aerial Surveys: Eyes in the Sky
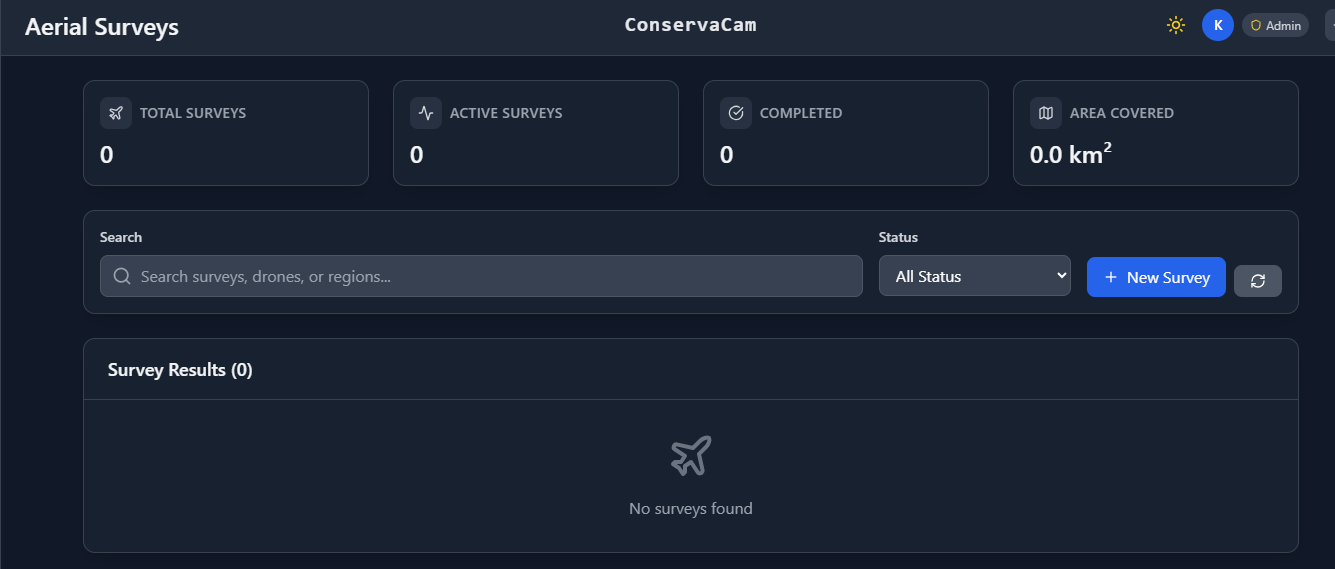
Ground cameras only tell half the story. Our Aerial Surveys module integrates flight data to track vast areas.
- Flight Metrics: We visualise key operational data like
Flight DurationandArea Covered (km²), allowing managers to track patrol efficiency. - Status Tracking: Flights are tracked through a lifecycle (Pending → In Progress → Completed) with visual status badges, ensuring no survey data goes missing.
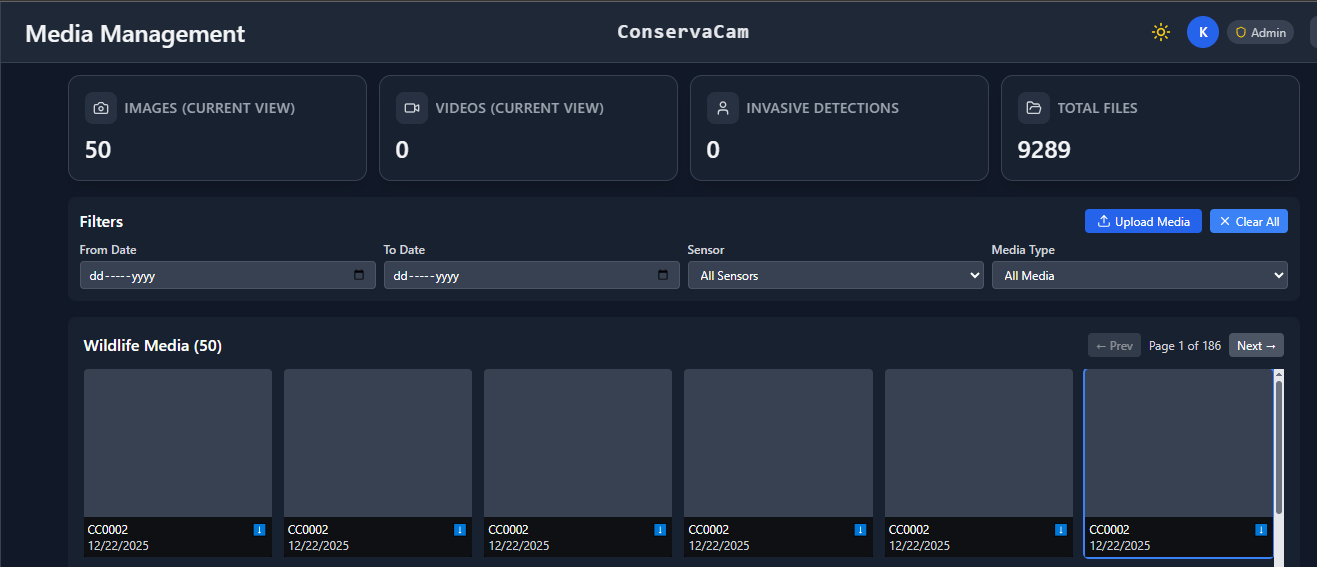
3. Media: The Central Archive
With thousands of images flowing in, organization is key. The Media Gallery isn't just a grid of photos; it's a smart database.
- Advanced Filtering: Users can rapidly filter by Sensor Source, Date Range, or Media Type (Image vs. Video).
- Invasive Detection Engine: A specialized logic layer isolates "Invasive" detections (e.g., Human/Poacher activity). Security teams can toggle a single switch to see only potential threats.
- High-Res Analysis: Clicking any media opens a dedicated modal with deep-zoom capabilities and metadata inspection.
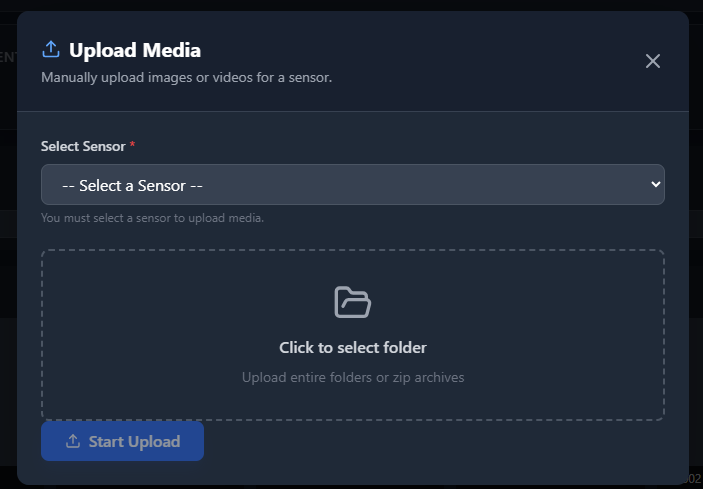
3.1 Media Upload: Bridging the Field-to-Cloud Gap
Not all sensors have cellular connectivity. Many camera traps store images locally on SD cards. Our Media Upload Modal handles manual batch uploads for these offline sensors.
Key Features:
- Folder Upload Support: Users can select entire folders uploading hundreds of images in one action.
- Batch Processing UI: When uploading multiple files, the interface switches to a "batch mode" showing aggregate progress (e.g., "450 of 500 files, 87% complete").
- Concurrent Uploads: The system uploads up to 3 files simultaneously, balancing speed with server load.
- AI Processing Pipeline: After upload completes, users can trigger the AI model with a single "Run Model" button, which queues detection jobs for all uploaded media.
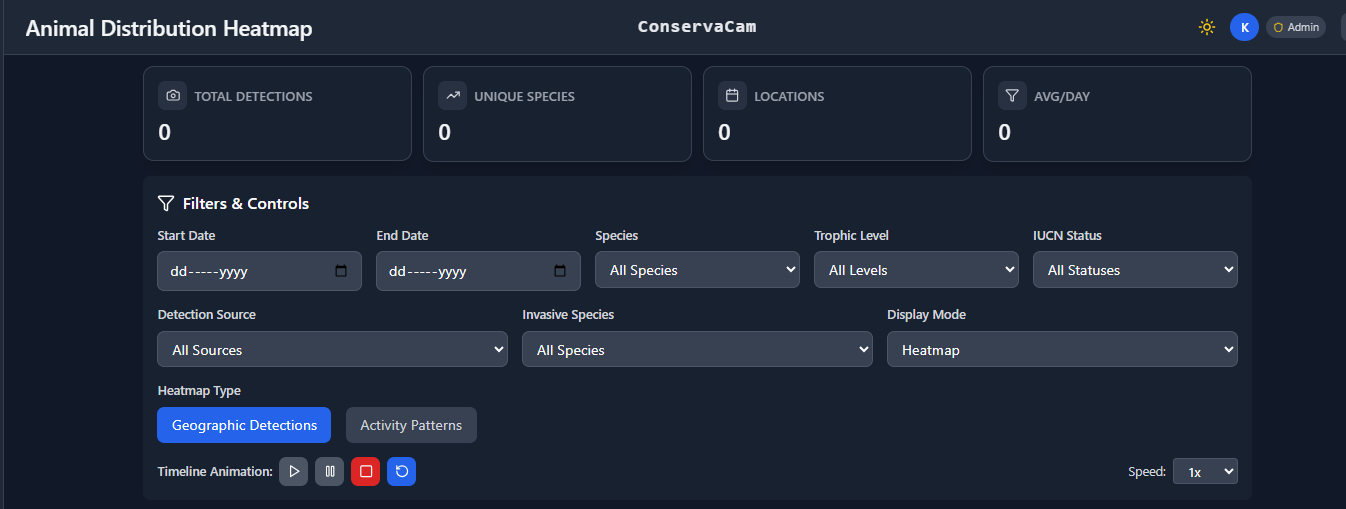
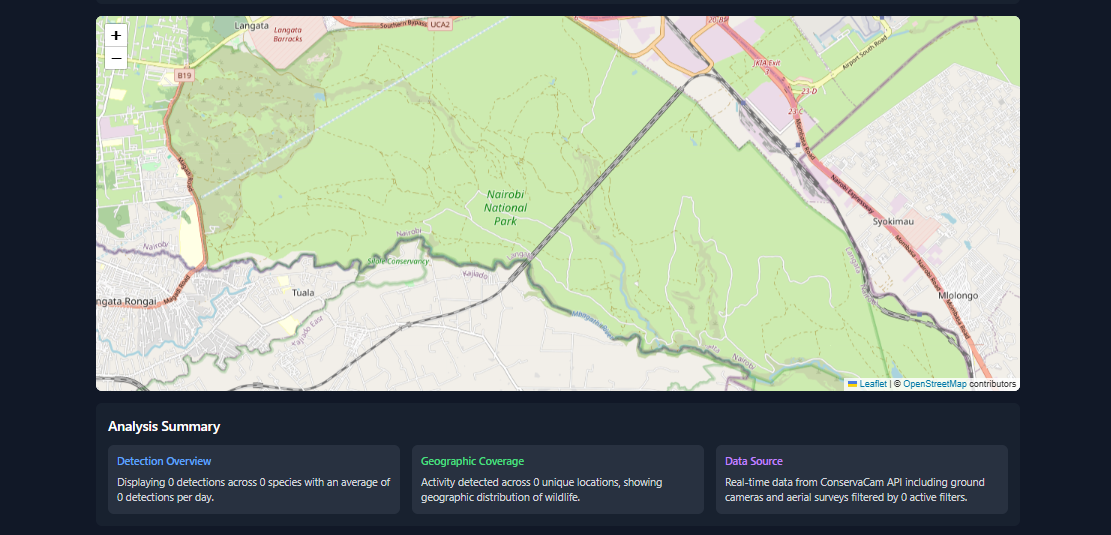
4. Heatmap: Spatio-Temporal Intelligence
Where do the animals go? The Heatmap page offers advanced spatial analysis using to visualise density.
- Granular Filters: Filters are based on biological criteria: Species, Trophic Level (Herbivore/Carnivore), and IUCN Status (Endangered/Critical).
- Time-Lapse Animation: A built-in playback control allows users to animate the heatmap over time, revealing migration corridors and shifting territory patterns.
- Dual Visualization Modes: Users can toggle between Heatmap Mode (for density) and Marker Mode (for precise individual locations).
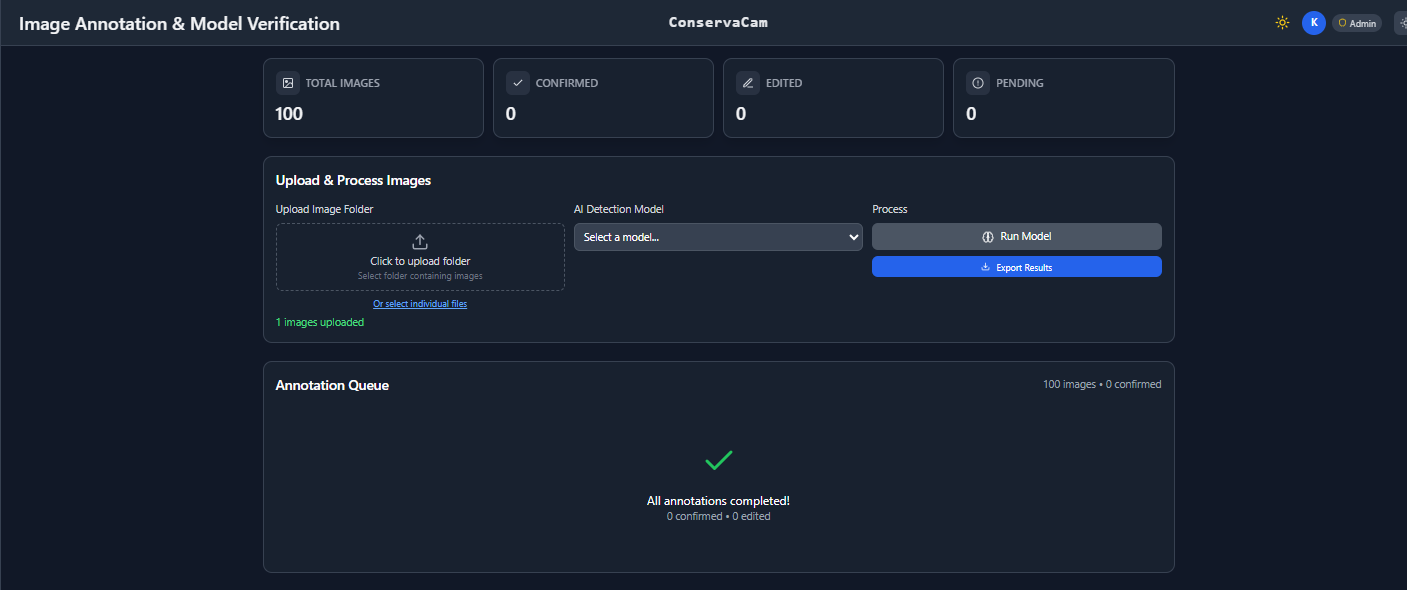
5. Annotation: AI-Assisted Verification
As of all models that learn on one data and are deployed in a different environment, meaning we need to train the data.
- Precision Tools: Users can draw and resize bounding boxes with sub-pixel accuracy.
- Species Taxonomy: Integrates with our species database, offering color-coded labels for distinct species groups.
- AI "Human-in-the-Loop": Annotators validate or correct AI model predictions via a "Show/Hide AI" toggle, speeding up processing by 10x.
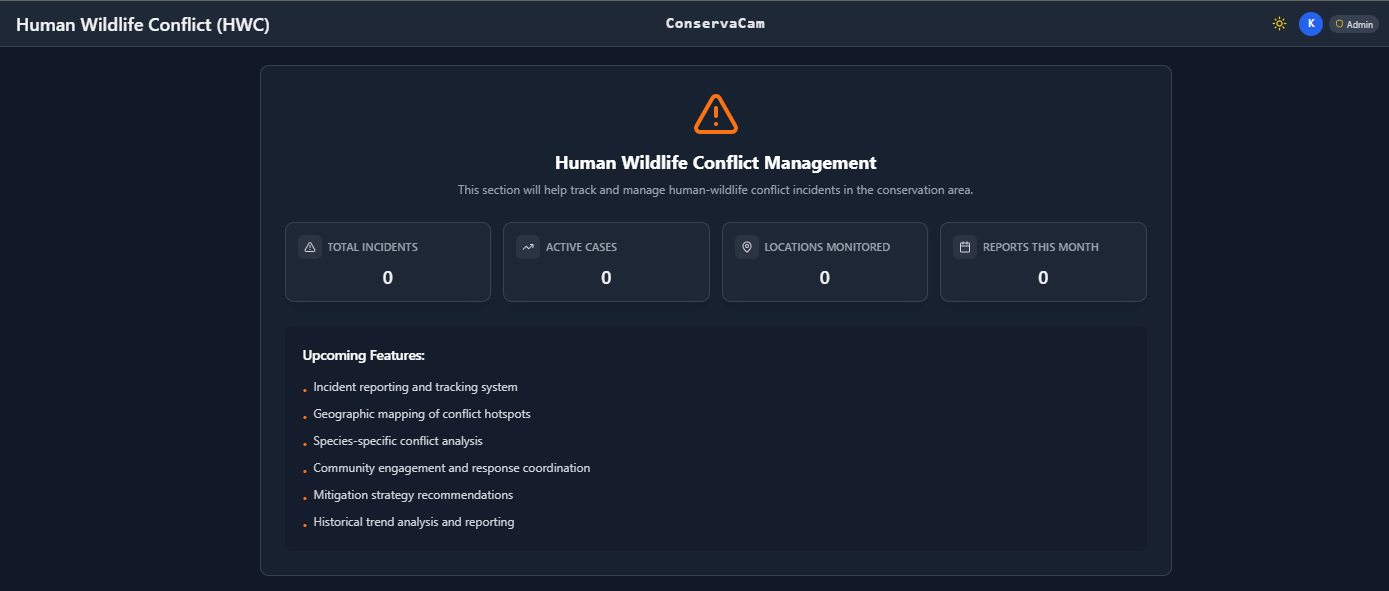
6. HWC: Human-Wildlife Conflict (Roadmap)
We are building a dedicated module for Human-Wildlife Conflict. This will track incidents, map conflict hotspots, and help coordinate community response teams to mitigate issues before they escalate.
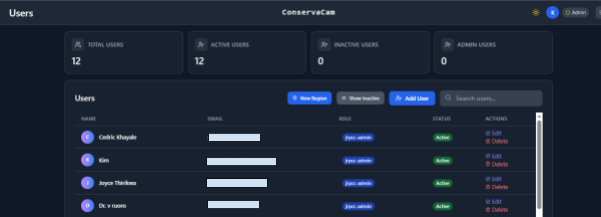
Secure Access: User Management and RBAC
Conservation data is sensitive. The Users module ensures strictly controlled access via Role-Based Access Control (RBAC).
- Admin Dashboard: Administrators can view a live breakdown of the workforce: Total Users, Active vs. Inactive, and Admin Distribution.
- Permission Guards: Critical actions (like deleting surveys or changing sensor status) are guarded by specific permission checks, ensuring data integrity.
The Tech Stack: The Engine Driving Conservation
We chose a modern, robust stack designed for performance and interactive data visualization:
| Component | Purpose | Key Feature |
|---|---|---|
| React (Vite Base) | Frontend Framework | Component-based UI for complex elements like the map and annotator. |
| Leaflet & React-Leaflet | Mapping | Industry standard for custom layers, heatmaps, and heavy clustering. |
| Recharts | Data Visualization | Composable, responsive graphs handling thousands of data points without lag. |
| TailwindCSS | Styling | Utility-first approach for rapid UI development and maintaining the Dark Mode. |
| Framer Motion | UX/Animation | Smooth transitions to make the interface feel alive and responsive. |
Conclusion
Building technology for wildlife conservation is a unique challenge. It’s not about "disrupting" a market; it’s about protecting an ecosystem. By combining robust cloud architecture with field-friendly UX, ConservaCam serves as a powerful ally to nature.
We’d love to hear your thoughts. Are you working on tech for nature? Let’s connect.