"Conservation is a data problem. We have thousands of images, but how do we make sense of them?"
In the vast landscapes where we monitor wildlife, data flows in from everywhere: hidden camera traps, high-flying drone surveys, and manual field reports. But raw data isn't enough. To make life-saving decisions for endangered species, conservationists need clarity. They need a system that turns a flood of JPEGs and GPS coordinates into actionable insights.
Here is an inside look at how we engineered the ConservaCam Dashboard to be exactly that, a mission control centre for the wild.
1. The Problem: Drowning in Raw Intelligence
Protecting national parks and sprawling reserves yields a colossal amount of intelligence. Rangers deploy hundreds of camera traps and conduct regular aerial drone patrols. The result? A digital avalanche. Every day, thousands of images and coordinates are captured.
Historically, this meant teams were forced to manually sift through SD cards full of blank photos (triggered by blowing grass) or spend hours cross-referencing GPS points on paper maps just to determine where a herd was moving.
2. The Agitation: Time is the Enemy of Conservation
When you are tracking vulnerable species or monitoring for illicit human activity, a delayed response is a failed response.
If a ranger has to spend three days organizing files before realizing a poacher was captured on a trail camera, the trail has already gone cold. If an ecologist cannot visualise how drought is shifting animal migration patterns because the data is trapped in disconnected spreadsheets, strategic interventions cannot be planned. The friction of generic, disconnected software was costing our teams the one resource they couldn't afford to lose: time.
3. The Solution: The ConservaCam Dashboard
We realised that conservationists didn't just need a place to store files; they needed a centralised, intelligent nervous system for the park.
Enter the ConservaCam Dashboard. We built a unified platform that ingests raw field data, applies advanced artificial intelligence to filter the noise, and maps the resulting intelligence in real-time. It bridges the gap between the muddy reality of the field and the clean analytics required for executive decision-making.
4. The Pulse of the Park: Operational Overview
To lead effectively, park managers need to understand the health of their territory the moment they log in. The Overview page serves as the ultimate decision-making hub, aggregating millions of data points into a single "Health Check."
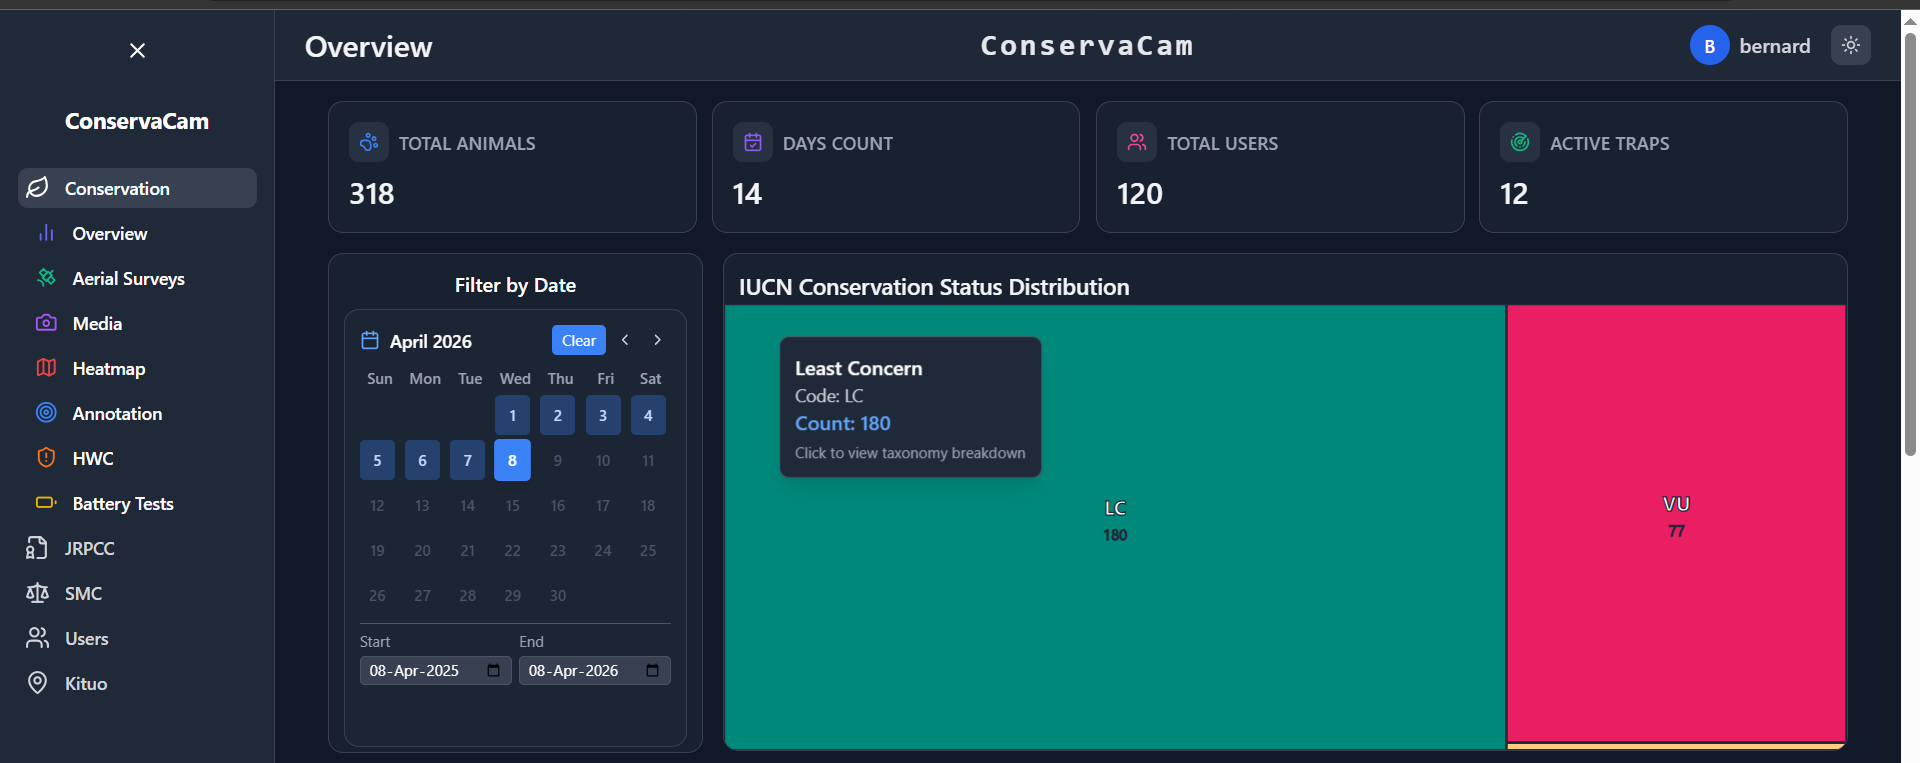
Overview grouped by IUCN classes
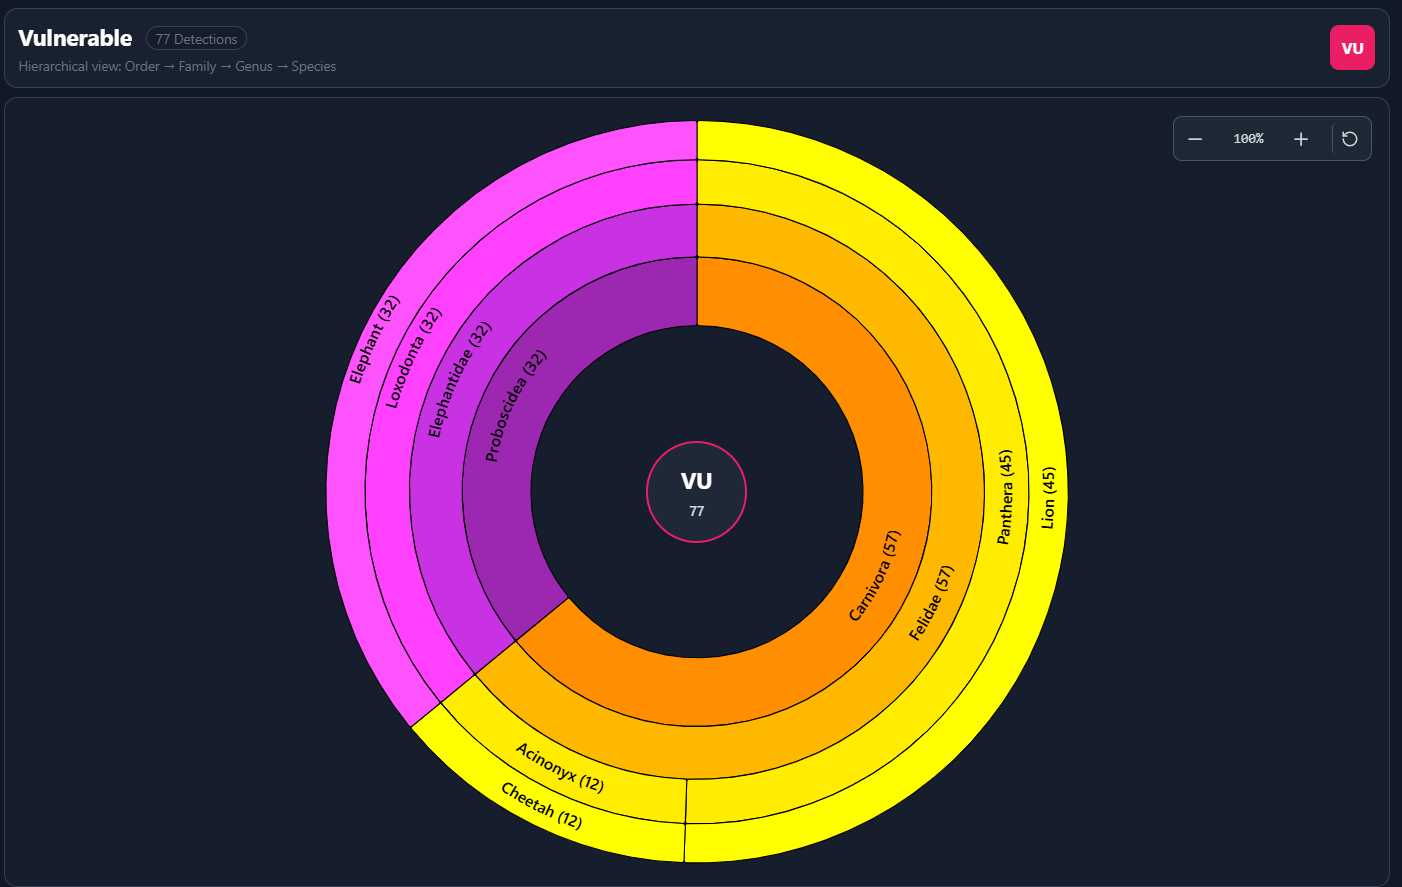
Sunburst charts to show the taxonomic breakdown of species count
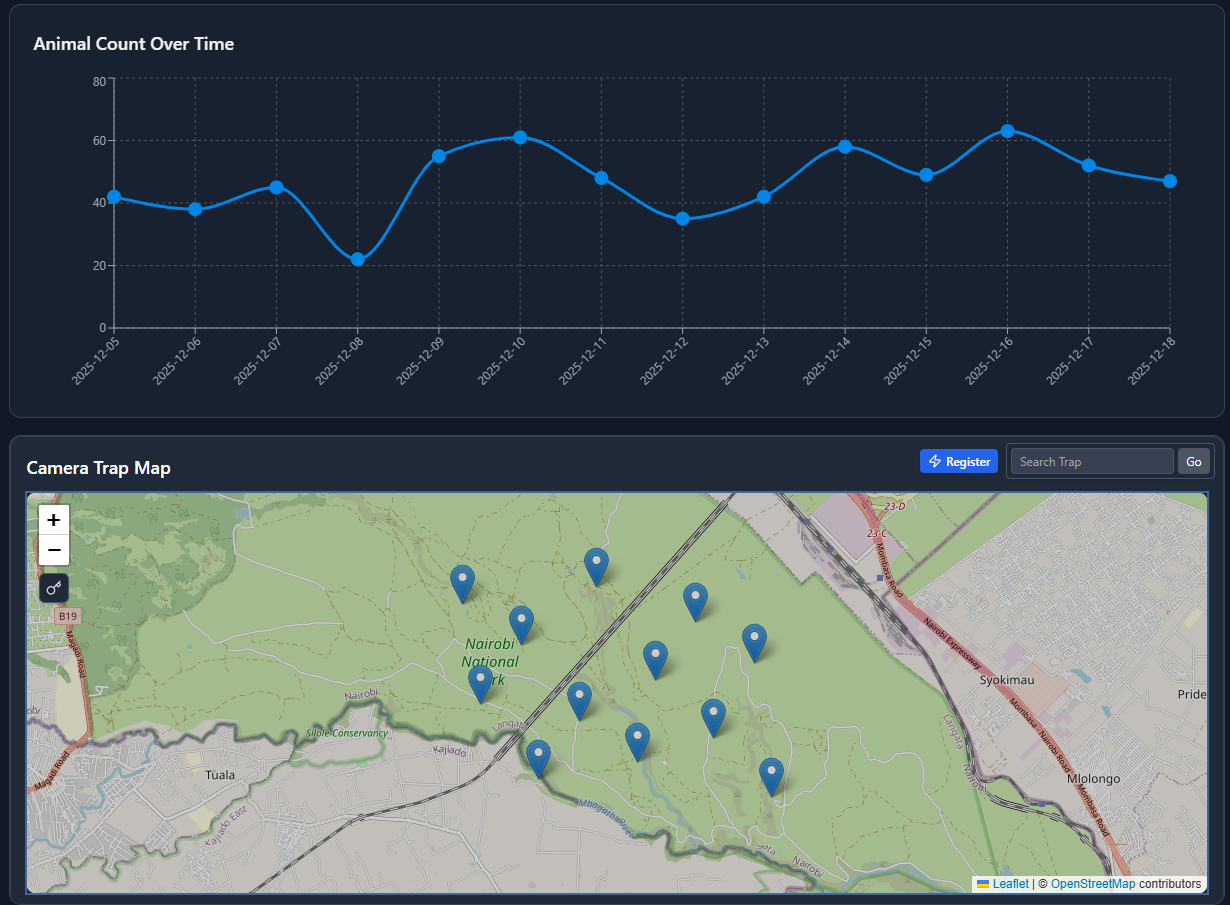
Camera Sensor Nodes Distribution
- Ecological Trends: We stripped away complex database queries in favour of interactive charts. These visualisations track animal counts over time and break down detections by specific species, offering an instant snapshot of biodiversity health.
- Live Sensor Map: Knowing where your cameras are is useless if you don't know if they are working. The dashboard provides a real-time geospatial view of every device using color-coded icons:
- Green: Online and operational.
- Orange: Low Battery warning.
- Red: Offline (Requires immediate maintenance).
- Black: Inactive (Showing the last known previous location).
5. Sensor Registration: Onboarding New Eyes in the Field
Data doesn't just magically appear; physical sensors act as our eyes in the bush. When deploying new hardware, the onboarding process must be frictionless.
Our Sensor Registration Modal streamlines this critical first step:
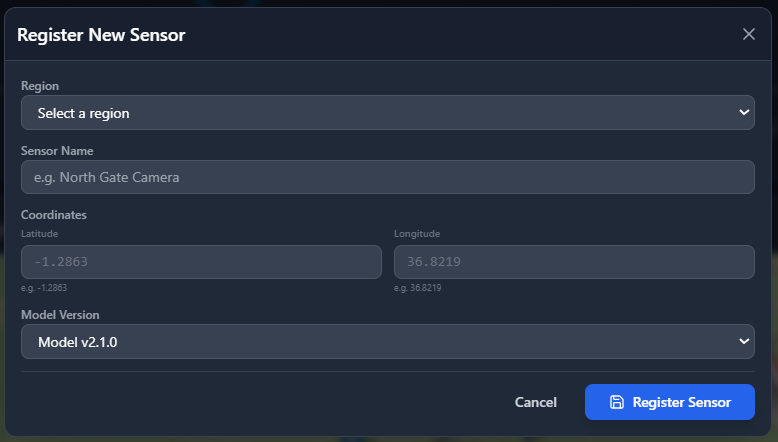
- Dedicated Ground Camera Tracking: The modal is strictly typed to register "ground_camera" endpoints, ensuring that camera trap data isn't mistakenly merged or confused with airborne drone feeds.
- Smart Region Access: National parks span massive territories with different jurisdictions. When a ranger opens the registration modal, the system intelligently restricts and loads only the specific regions (like Tsavo East or the Masai Mara) that they are authorized to access, ensuring absolute data sovereignty.
- Abstracted Spatial Intelligence: In the field, rangers shouldn't have to worry about writing complex SQL strings just to log a location. While our backend requires coordinates formatted in WKT (Well-Known Text) for complex spatial mapping, the UI abstracts this away entirely. The user simply types the standard Latitude and Longitude numbers into clean, separate boxes, and the system automatically compiles it into the robust POINT(longitude latitude) format behind the scenes.
6. Aerial Surveys: Eyes in the Sky
Ground cameras are incredibly effective, but they only tell half the story. Tracking vast, remote areas requires an elevated perspective.
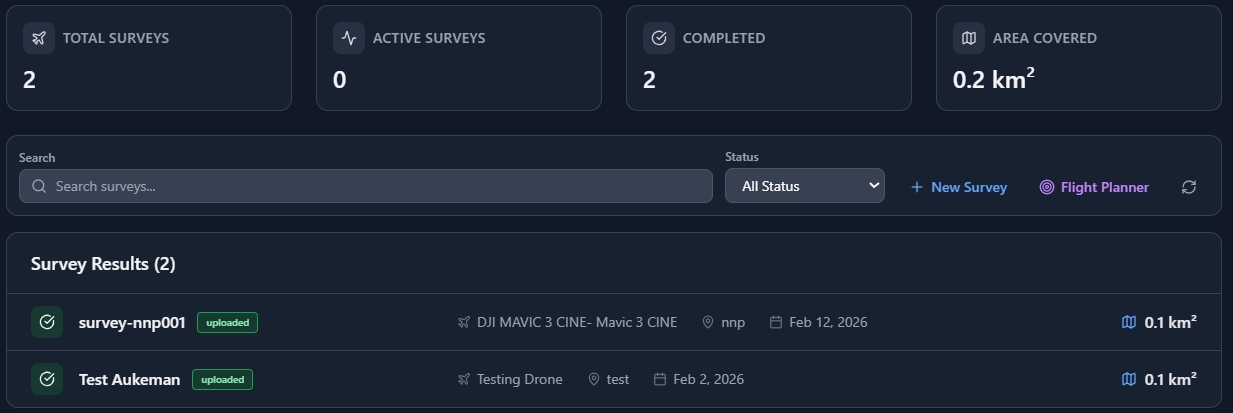
List of aerial Surveys
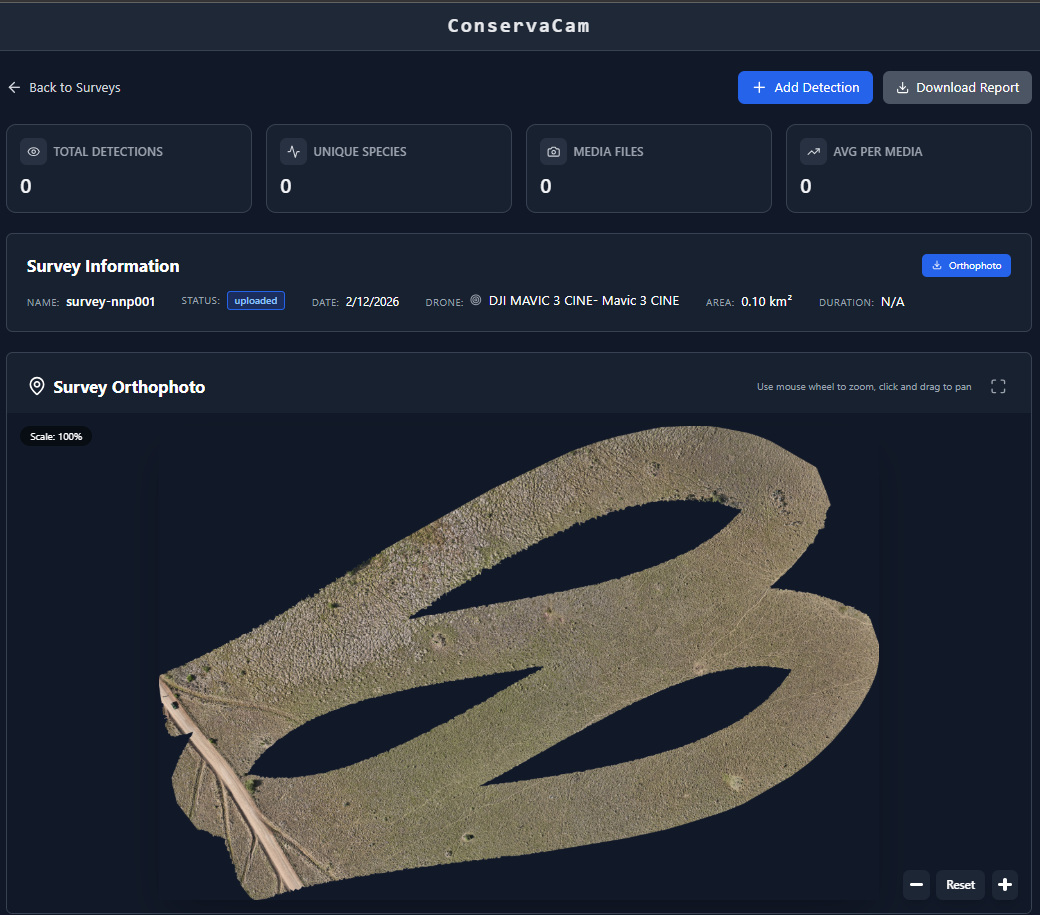
Sample Drone stitching for one of the surveys
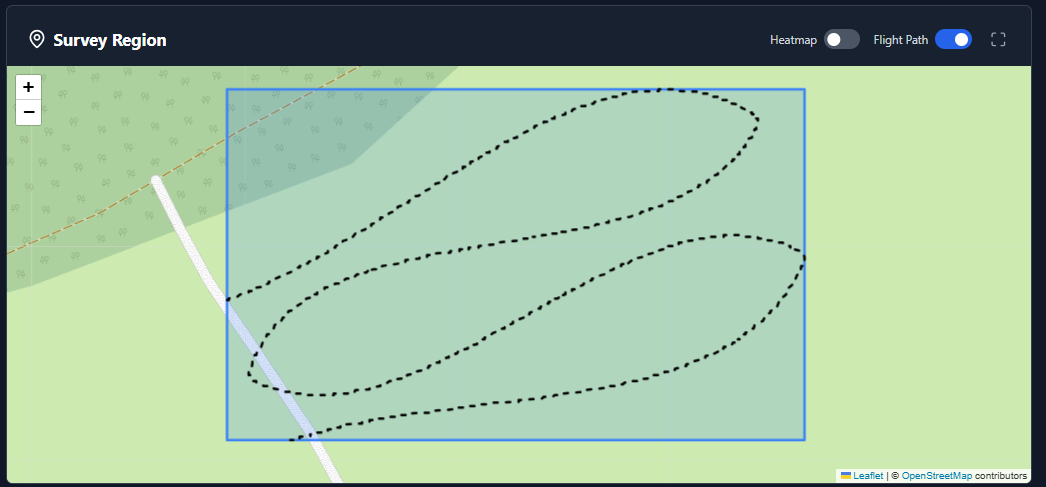
Drone flight path
- Flight Metrics: Park managers can instantly visualize key operational data, such as total Flight Duration and the aggregate Area Covered in square kilometers.
- Status Tracking: Flights are actively tracked through a rigid lifecycle (Pending → In Progress → Completed) with clear visual badges.
- Flight planner: We included a flight planner for which you can plan your flights and generate coordinates based on individual runs.
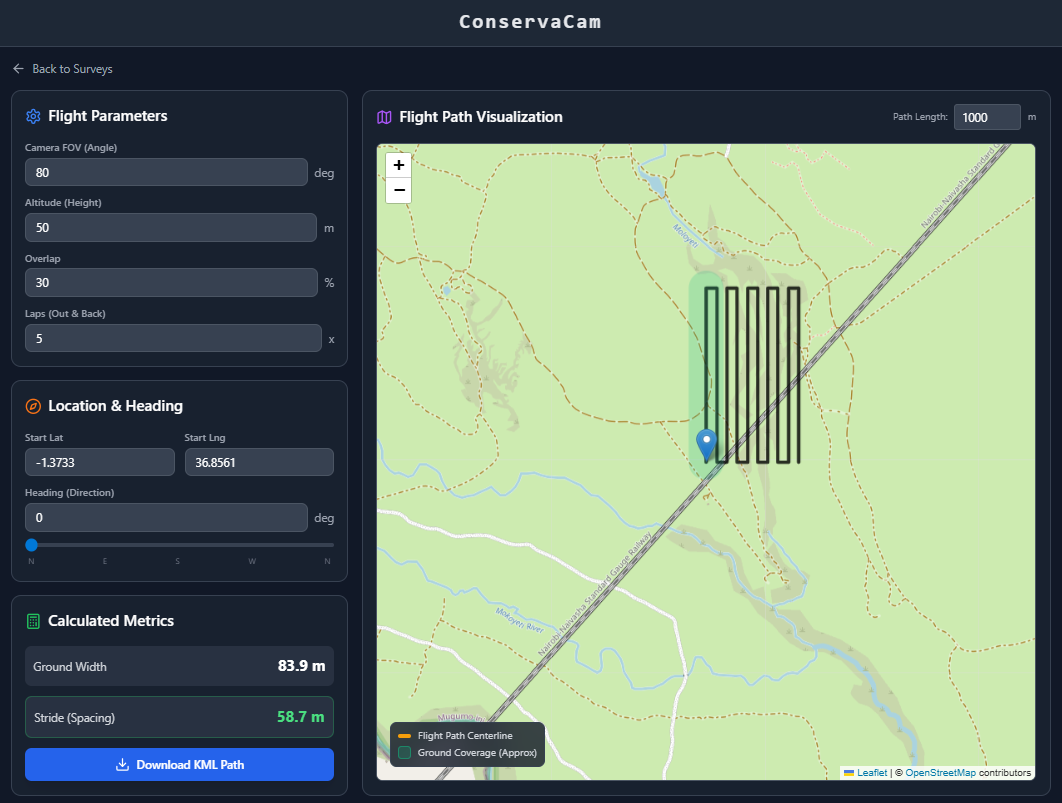
Drone Flight Planner
7. Media & AI Verification: The Central Archive
With thousands of images flowing in daily, organization is paramount. The Media Gallery is a highly intelligent, searchable database.
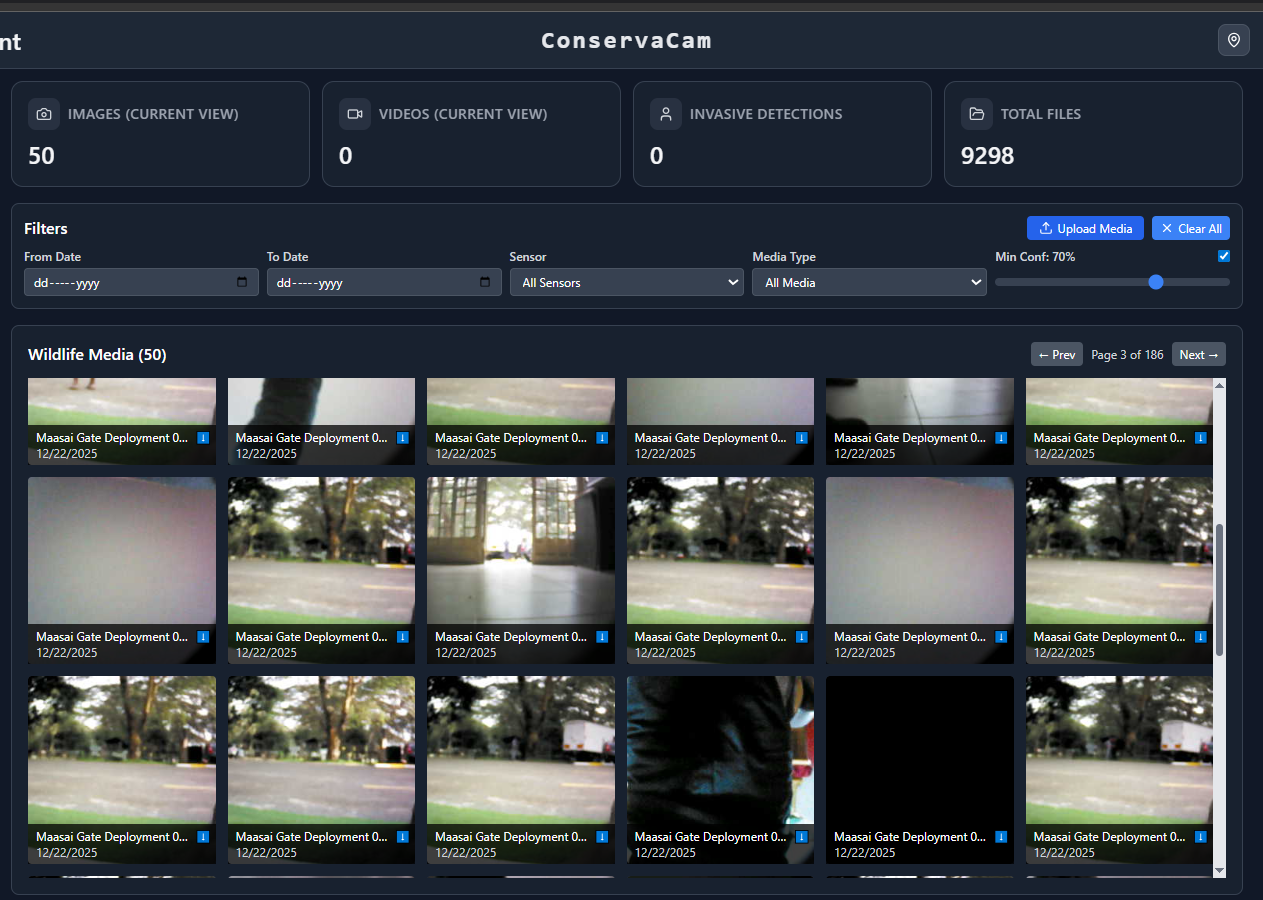
Media Page
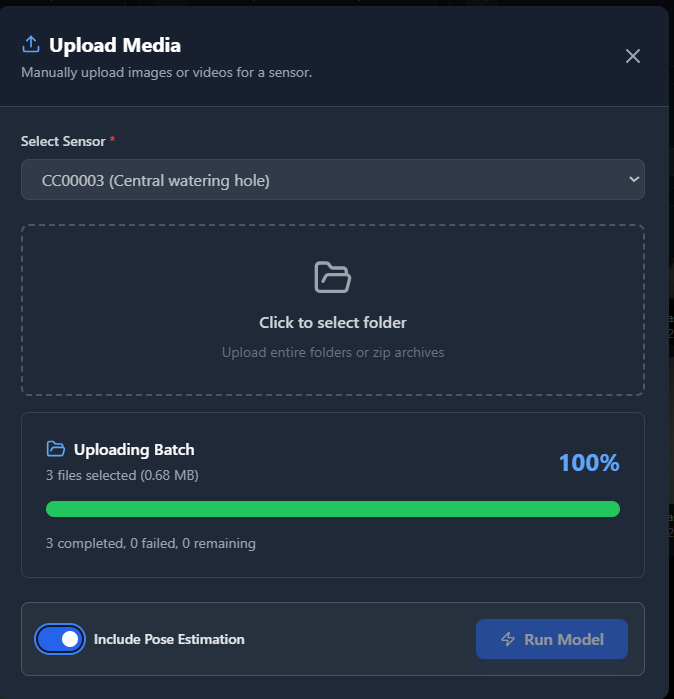
- Batched Upload Processing: Rangers can drag and drop entire folders, and the system batches them (uploading 3 concurrently) while displaying a clear progress bar.
- The Invasive Detection Engine: A specialized logic layer allows teams to toggle a single switch to isolate "Invasive" detections, specifically focusing on human or poacher activity.
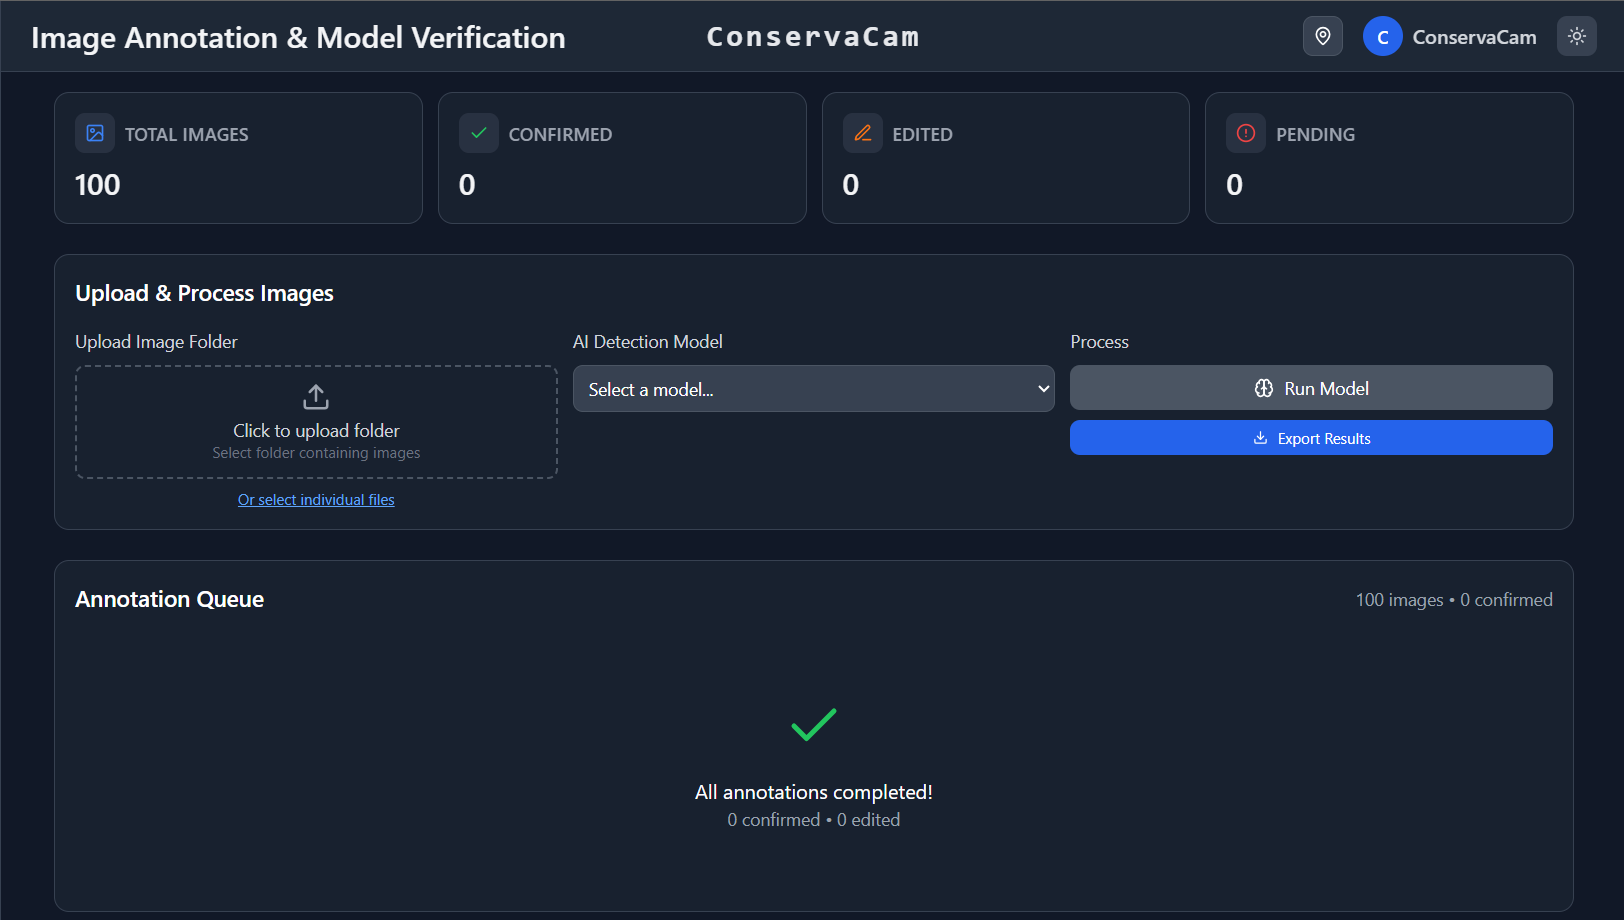
- AI-Assisted Verification (Human-in-the-Loop): We built an Annotation tool where experts can draw bounding boxes and tag species using our integrated taxonomy database. This feedback loop speeds up processing by 10x.
8. Heatmaps: Spatio-Temporal Intelligence
Knowing what is in the park is good, but knowing where they go is transformative.
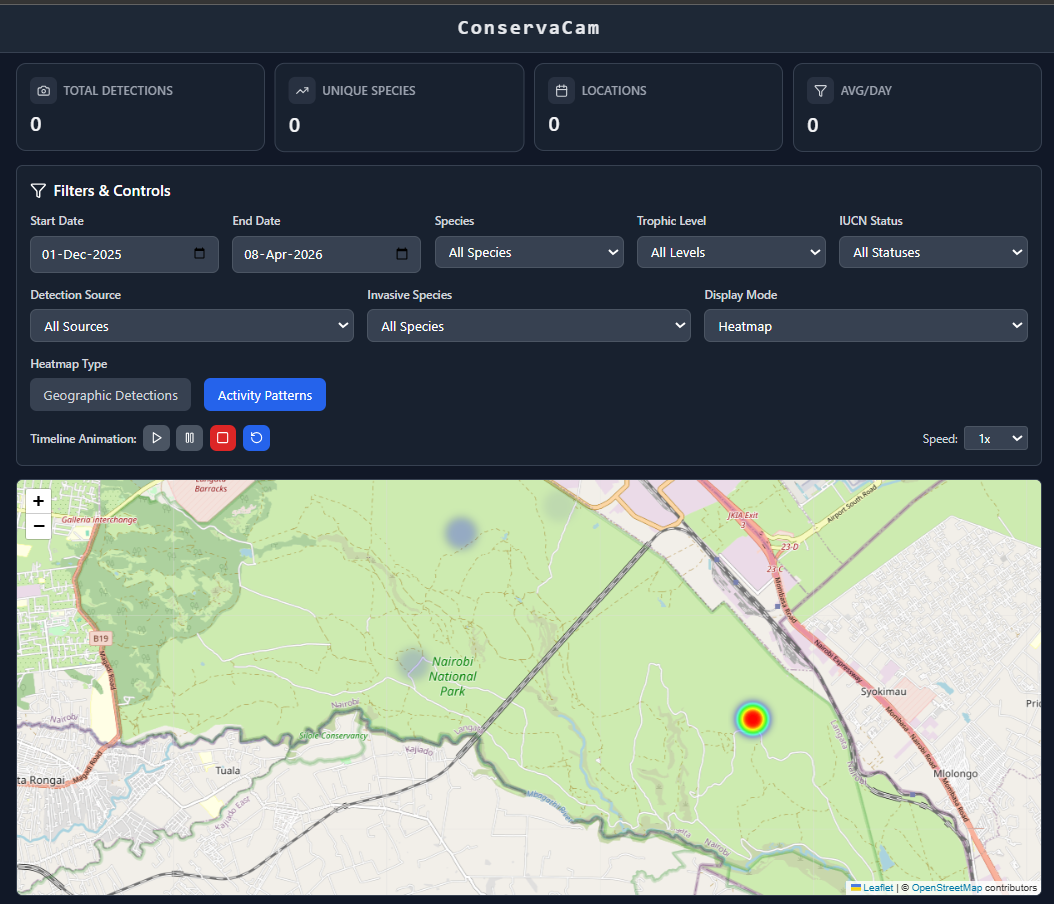
- Granular Biological Filters: Users can filter by precise ecological criteria, such as Species, Trophic Levels, and IUCN Status.
- Time-Lapse Animation: A built-in playback controller allows ecologists to animate the heatmap over months or years, revealing hidden migration corridors.
- Dual Visualization: Users can seamlessly toggle between a broad Heatmap Mode and a precise Marker Mode.
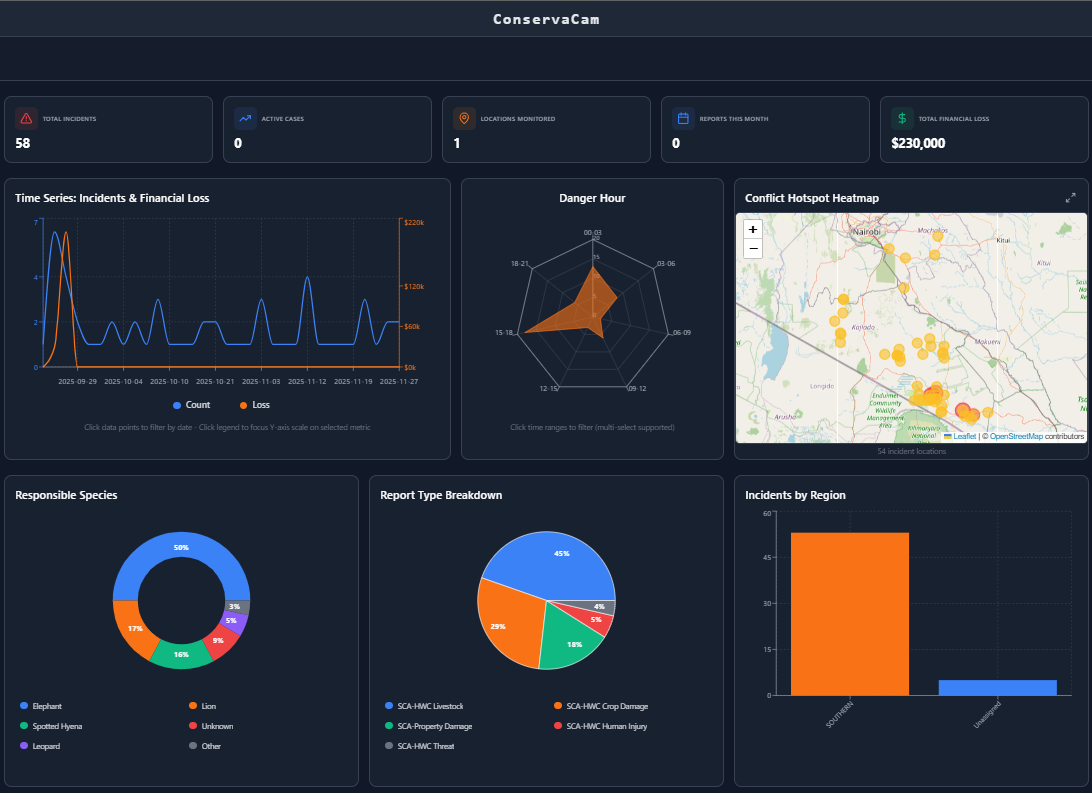
9. Looking Ahead: Mitigating Conflict and Securing Data
We are never finished iterating. Next on our roadmap is a dedicated module for Human-Wildlife Conflict (HWC). This will allow teams to track negative interactions, map historic conflict hotspots, and coordinate rapid community response teams. Currently the dashboard facilitates historical records of conflicts to be able to make Kenya Wildlife Service understand hotspots and plan mitigation strategies.
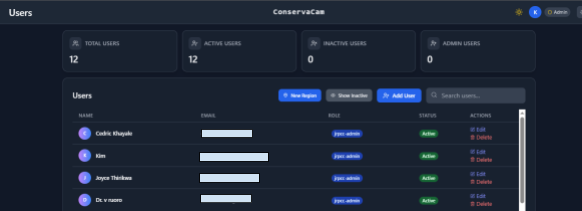
Finally, because conservation data, like the exact locations of endangered rhinos, is highly sensitive, the entire platform is secured with strict Role-Based Access Control (RBAC). By building ConservaCam, we aren't just logging photos; we are giving wildlife a voice and giving those who protect them the ultimate technological advantage.